OTN Systems (2016 - 2024)
OTN Systems creates mission-critical packet networks for specific industrial markets. XTran networks are based on the latest MPLS-TP standard (MultiProtocol Label Switching – Transport Profile). This packet technology caters to deterministic traffic, sub 50 ms reconfiguration times and flawless IP transport. XTran nodes are connected with fibre or copper links in any physical topology.
I was part of the software team and worked on TXCare, the network management and monitoring system for XTran networks.
Large Network Monitor
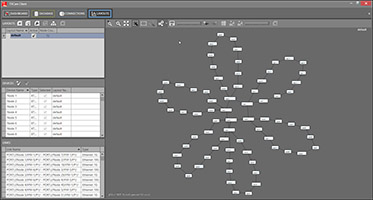
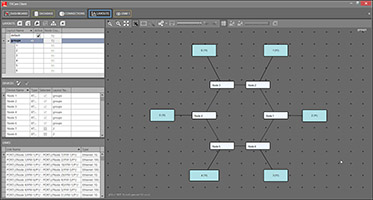
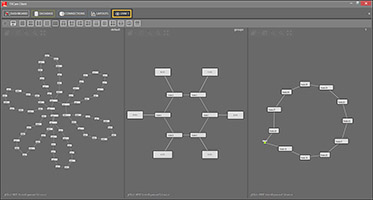
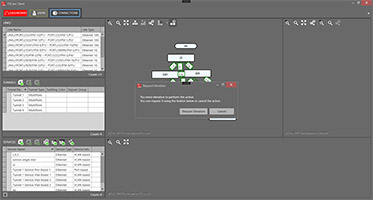
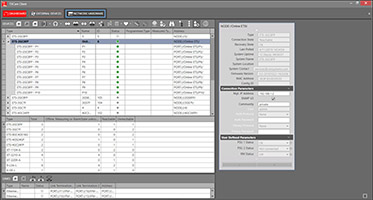
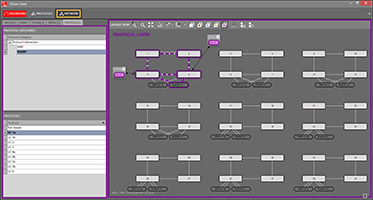
My first big feature at OTN Systems was the large network monitor. Some clients started to have bigger networks and TXCare didn't really handle displaying those networks in a clear way very well. We made a hierarchic solution in which clients can group network nodes and navigate up and down the various levels.
Secondly, we integrated OTN's older network monitor software so that clients that were still running a lot of the old hardware could use TXCare's new large network monitor functionality to monitor those older networks as well.
User Management
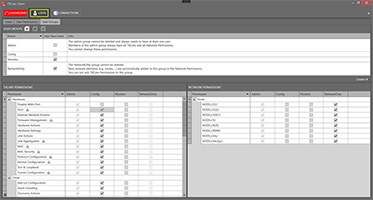
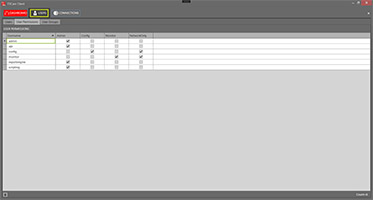
TXCare used to have pretty limited user management. A user was assigned to one of three groups (Admin, Config or Monitor) and that would determine the user's permissions. I had to create a new system where user permissions could be assigned more granularly. It is now possible to create user groups and assign permissions to those groups. You can then assign users to one or more user groups and a user can do everything that at least one of those groups is allowed to do. We also added a feature called Elevation where only one user can make configuration changes at a time.
SNMP Northbound
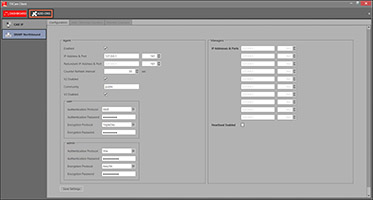
The TXCare software monitors the XTran network and bundles all that information in a graphical user interface. However, there was also a need for a more automated system that notifies other pieces of software of important events and alarms. We added a northbound interface that clients can use to subscribe to the pieces of information they are interested in.
Framework for Generic Devices
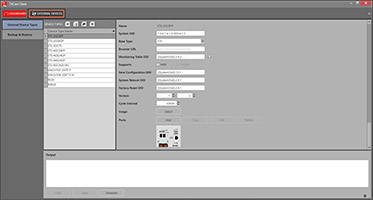
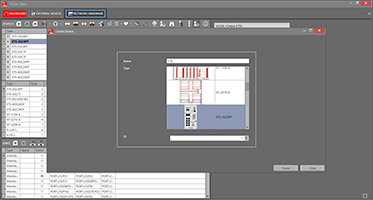
TXCare is designed to monitor and configure XTran nodes. Some partners wanted to be able to monitor their own hardware nodes using TXCare and we wanted to avoid having to manually add all those hardware nodes to the source code, so I created a generic device framework in which clients can define their own hardware nodes. These generic devices are then dynamically compiled into an assembly and can then be used and monitored (through SNMP) in TXCare just like the standard XTran nodes.
Backup & Restore Of Generic Device Configurations
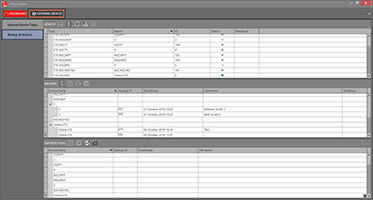
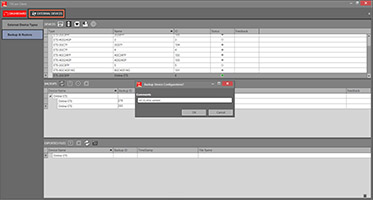
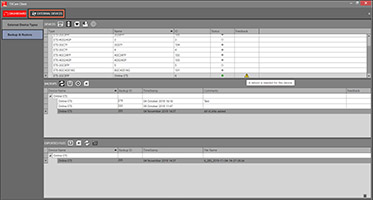
Our networks often contain a lot of generic devices (created with the generic device framework described above). These devices usually have a web interface to configure them, but when you have a thousand of these devices, you're not gonna have a lot of fun. I added functionality in TXCare to manage part of this configuration. Now it's a lot easier to make backups of current device configurations, edit them, restore them, reboot all devices, etc.
MRP and RGERP Protocols
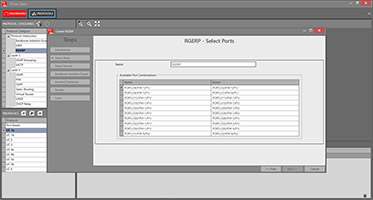
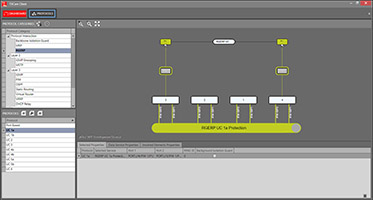
MRP and RGERP protocols are used in ring networks to avoid broadcast storms and ethernet loops. This means that MRP/RGERP will block at least one port in the ring to avoid ethernet loops. All the other ports will be open or unblocked. If a physical ring break occurs in the ring (e.g disconnected or broken cable) MRP/RGERP will detect this and block/unblock all the ring ports in such a way that all the nodes are still reachable via the XTran network. I implemented these protocols in TXCare, both the user interface as well as the actual protocols.
Multi Element Properties Window
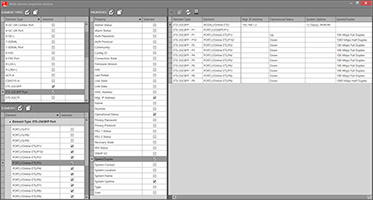
In various parts of the user interface, properties of the network can be monitored, but a central window where multiple properties of various hardware elements could be monitored at the same time was missing. I got to make this window, which was a lot of fun to create. Users can select the element types they want to monitor, then the elements of the selected types they want to monitor and then the properties whose values they want to see. Big networks contain thousands of hardware elements and a multitude of properties, so it was a challenge to make this window both performant as intuitive.
Support Tools
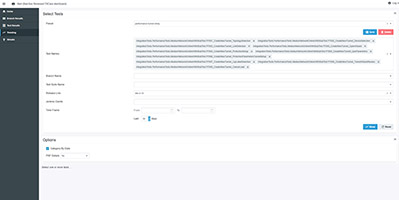
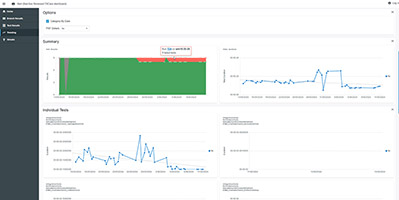
At OTN Systems, we had quite an elaborate automated testing setup. We have several tools and websites to support this. I created a Blazor website containing various graphs that show trending of test timings, in the context of performance improvements.
Various User Interface Improvements
These ranged from both technical improvements, making the user interface more robust and unit testable, to visual improvements, improving the design, look, intuitiveness and usability of TXCare.
